Gitlyzer fetches, classifies, and visualises every commit and pull request
across your entire GitHub organisation, without sending a single byte
of code to a third party. Runs on your infrastructure, backed by PostgreSQL.
Incremental, idempotent data collection meets an interactive web dashboard, no manual spreadsheets, no third-party SaaS.
Commit Classification Engine
Every commit is automatically classified into 30+ semantic types using pattern matching on message content, diff stats, and branch context. Track noise vs. meaningful change over time.
feature_commitbugfix_commithotfix_commitsecurity_fixrefactor+25 more
PR Review Analytics
Measure average and median review time, PR size distribution, merge rate, and which authors get reviewed fastest. Identify bottlenecks before they block delivery. Track PRs merged without any review.
Review TimeMerge RateSize DistributionMerged Without Review
Commit & PR Trends
Visualise commit velocity, PR throughput, and activity patterns at daily, weekly, or monthly granularity. Chart.js powered interactive charts built into every dashboard view.
Chart.jsDailyWeeklyMonthly
Team & User Profiles
Drill into individual contributors or entire teams. Each profile shows commits by type, PR stats, top repos, and activity periods across configurable time windows, all time, last year, last 3 months.
User ProfileTeam ViewSub-teams
Local Clone Support
Clone repositories locally for faster, rate-limit-free data fetching. Smart size-based selection automatically falls back to the GitHub API for oversized repos. Configurable clone directory and cleanup policy.
Faster FetchAuto FallbackGitPython
Commit & PR Statistics
Rank contributors and repositories by gross lines, net lines, noise ratio, or PR count. Full-text search, column sorting, and pagination handle orgs with hundreds of engineers.
By UsersBy ReposBy TeamsSearch & Sort
Secure Admin Area
A dedicated admin interface with session-based Flask-Login authentication, bcrypt password hashing, repository management via AJAX toggles, and a data sync dashboard for triggering fetch jobs.
Flask-LoginbcryptAJAX Toggles
Incremental & Idempotent
Re-run any fetch job safely, already-processed records are skipped automatically. Supports --since and --until flags for targeted backfills and daily cron automation.
IdempotentCron ReadyDate Range
Robust PostgreSQL Schema
11 tables with foreign keys, ON DELETE CASCADE, and proper indexes covering commits, PRs, teams, users, contributions, and classification results.
PostgreSQL 13+11 Tablespsycopg2
Product Screenshots
See Gitlyzer in action
Real views from a live deployment, every chart and table pulls directly from your GitHub data. Click any screenshot to enlarge.
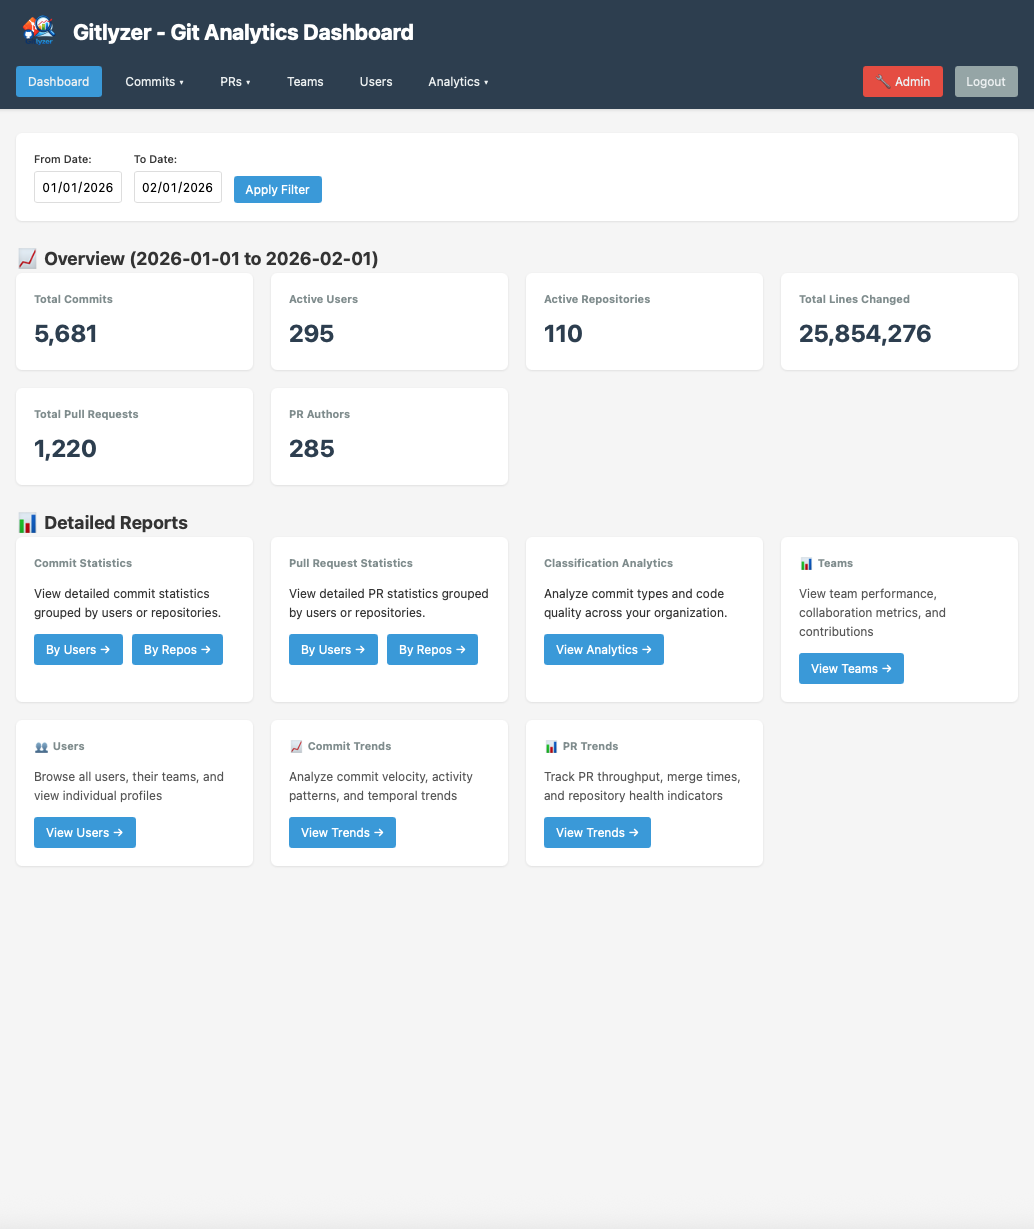
View 01, Main Dashboard
Your entire org at a glance
The home screen surfaces the numbers leadership cares about: total commits, pull requests, active repositories, and contributors, with top-level trend indicators for each.
Commit, PR, repo and contributor totals in one view
Classification summary always visible
Quick-access links to every analytics view
Date-range filtering across the whole dashboard
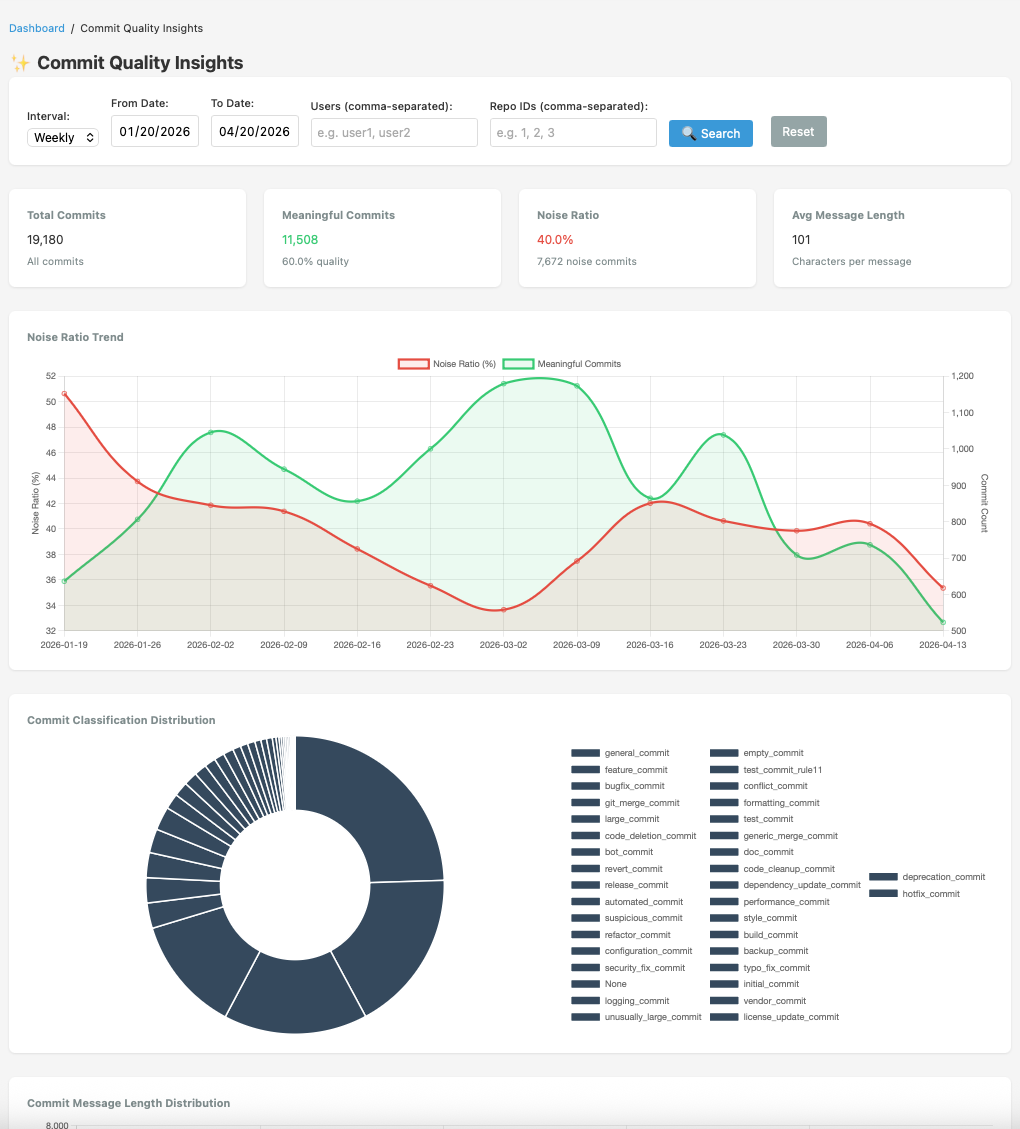
View 02, Commit Quality Insights
Separate signal from noise
The quality dashboard breaks down commit classification by type, tracks noise ratio over time, and flags outliers, large commits, reverts, and automated activity, that inflate apparent throughput without adding engineering value.
Noise ratio trend over configurable time windows
Interactive donut: feature vs. fix vs. overhead
Average commit message length as a quality proxy
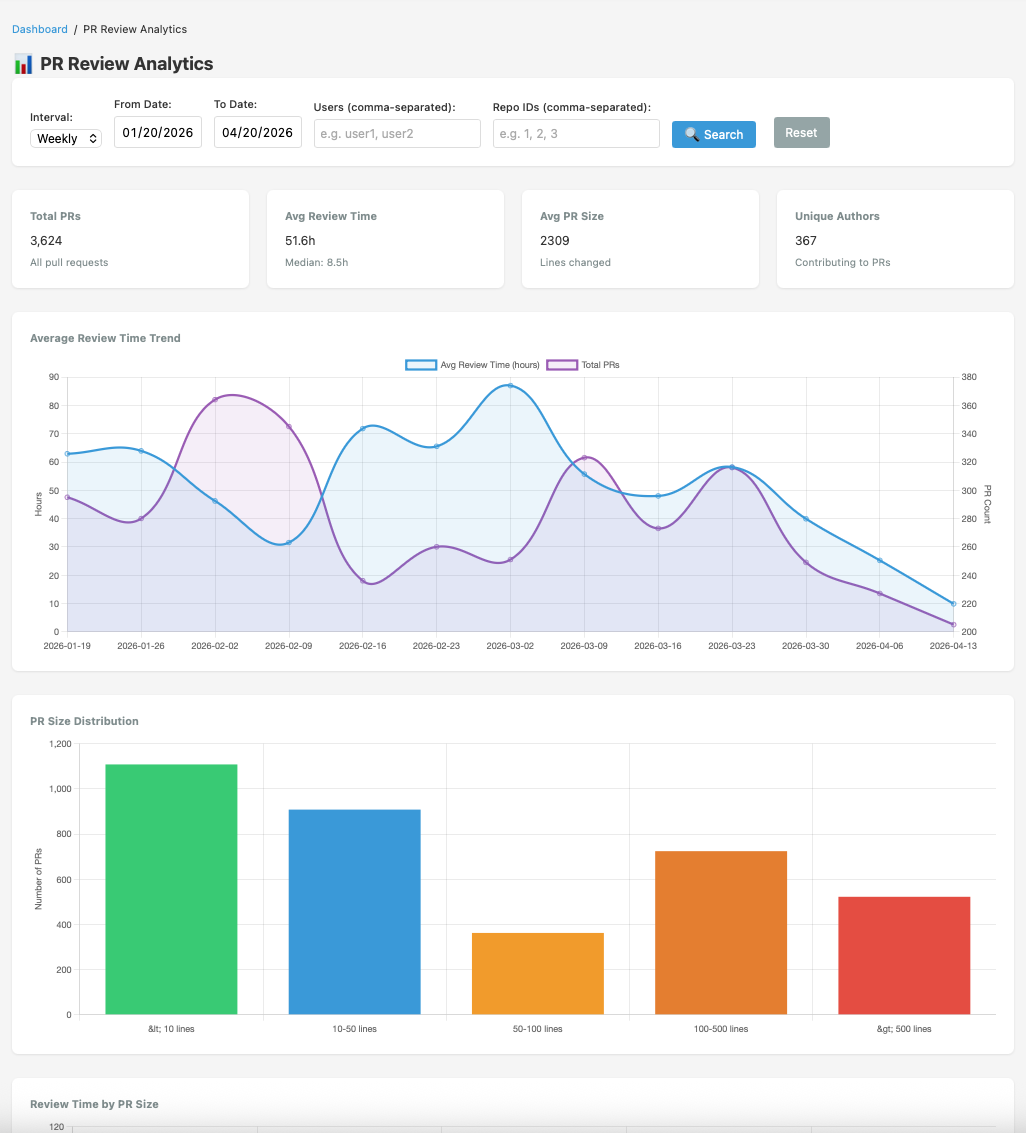
View 03, PR Review Analytics
Find the review bottleneck
Track average and median review time, visualise PR size distribution, and identify who reviews most (and least). Most importantly, see every PR merged without any review, the risk no team wants to ignore.
Review time trend with median vs. mean comparison
PR size distribution histogram (LOC buckets)
Merged-without-review alert table
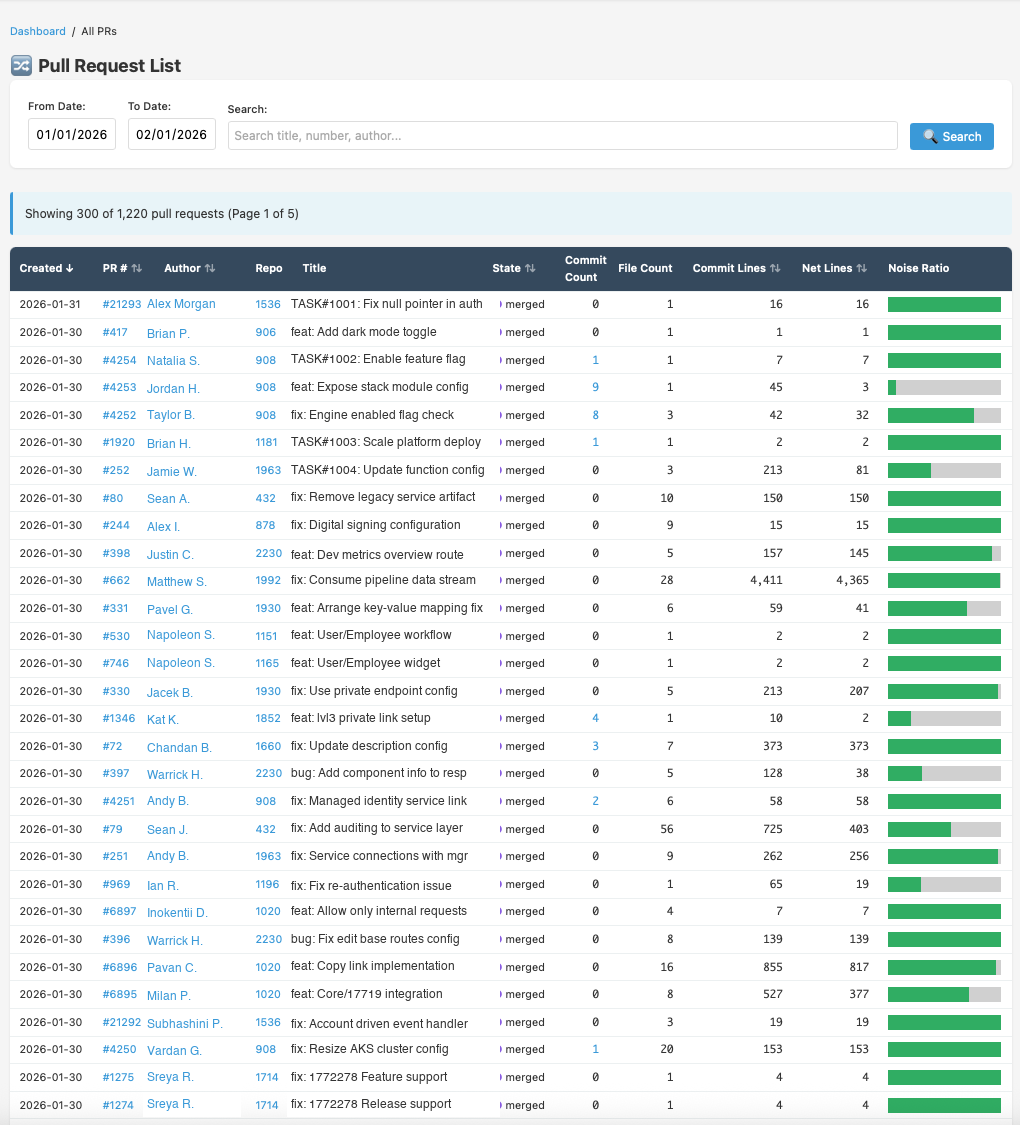
View 04, Pull Request List
Every PR, fully detailed
A sortable table of all pull requests with author, repository, title, state, commit count, lines changed, and noise ratio in one place. Filter by date range or search by title and author.
300+ PRs per page with full metadata
Noise ratio bar visual per PR
Click commit count to see individual commits
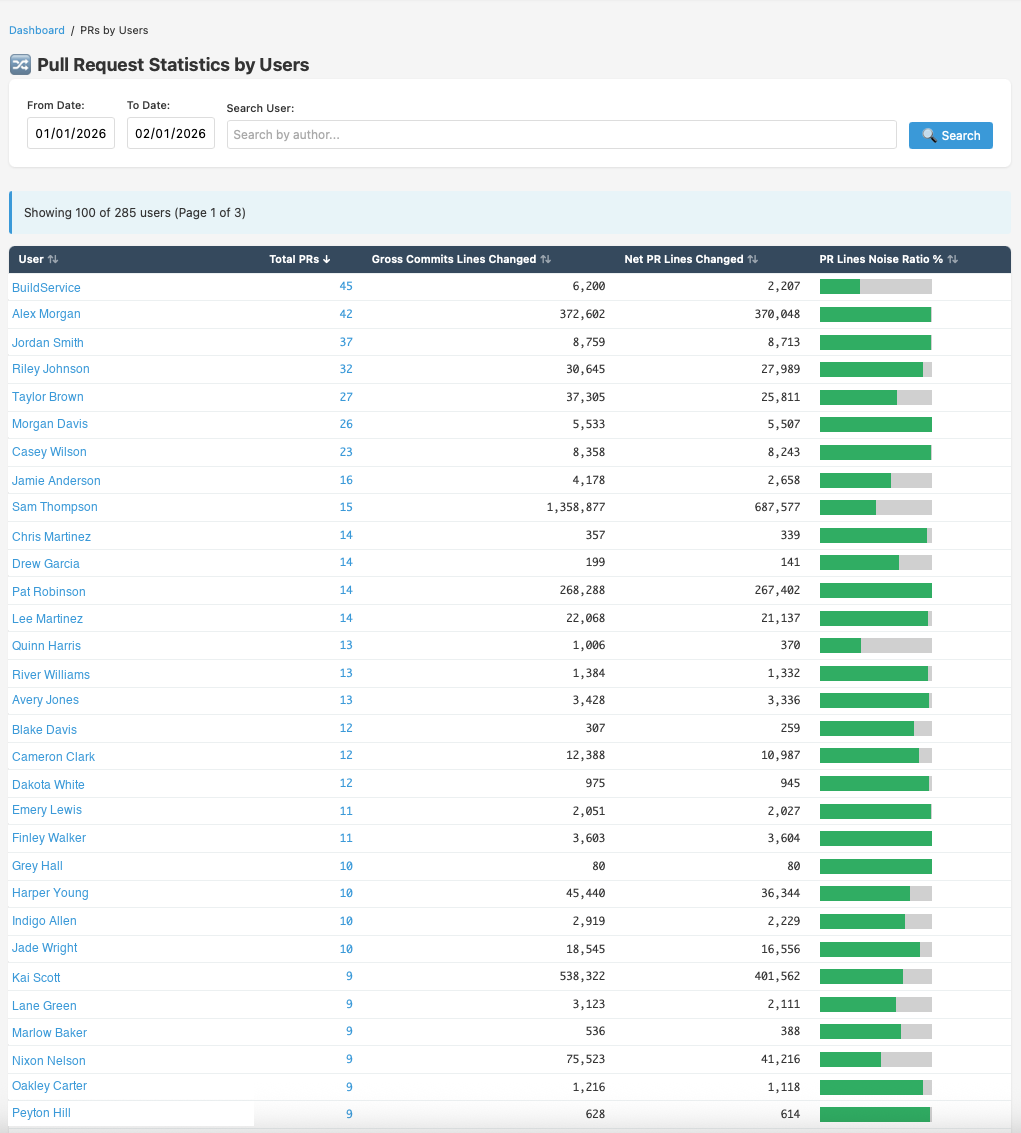
View 05, PR Statistics by Users
Get contributors insights
Visualize contributors - PRs, gross commit lines, net lines, and noise ratio. Drill into any engineer for a full profile, their classification breakdown, top repos, commit activity, and timeline.
Sortable by PRs, lines changed, or noise ratio
Click-through to individual user profile
Team-level aggregation alongside per-user view
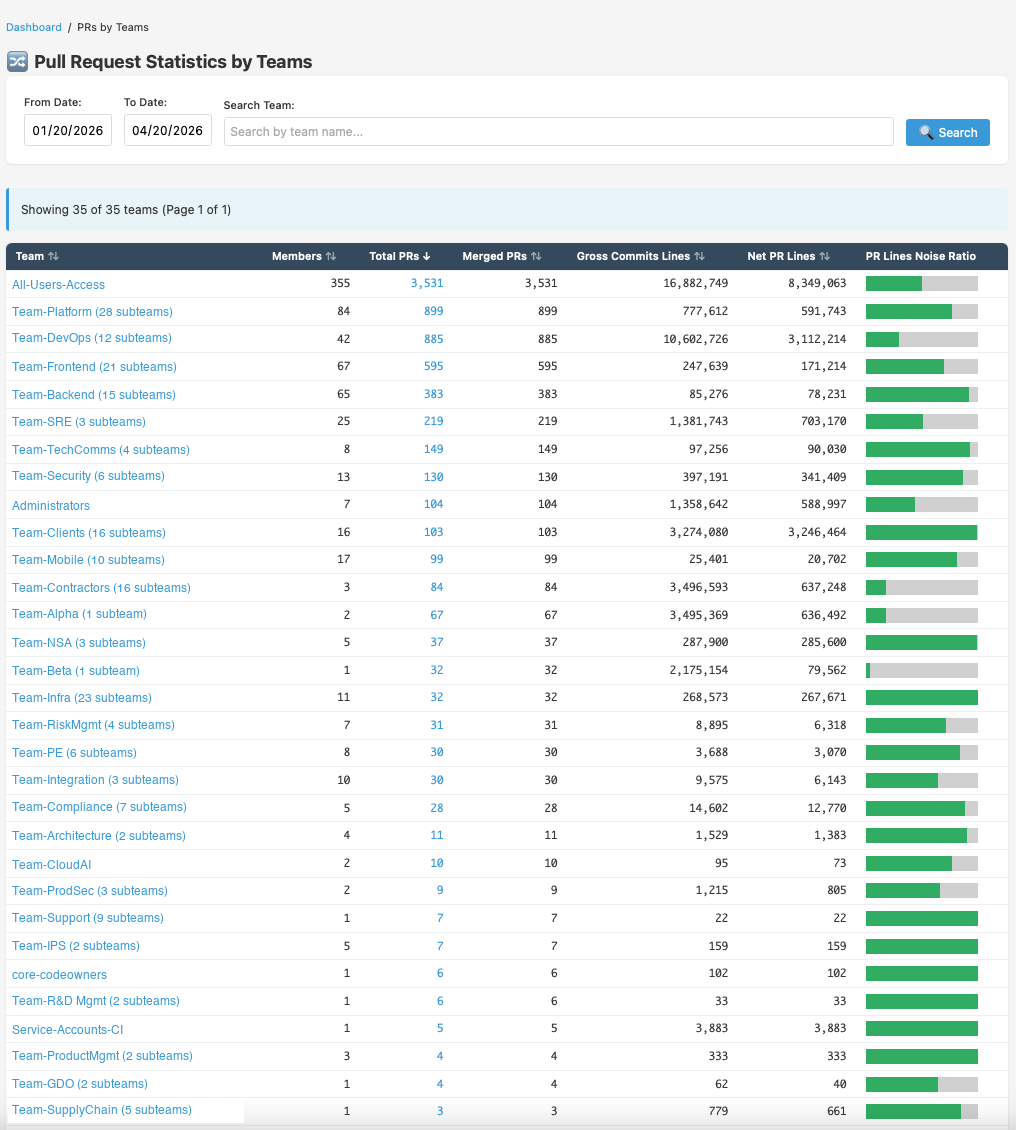
View 06, PR Statistics by Teams
Team-level PR throughput
See PR output broken down by GitHub team, members, total PRs, merged PRs, gross commit lines, net PR lines, and noise ratio side by side for every team in your org.
Teams stats and PR volume
Noise ratio bar for instant quality comparison
Sortable by any column
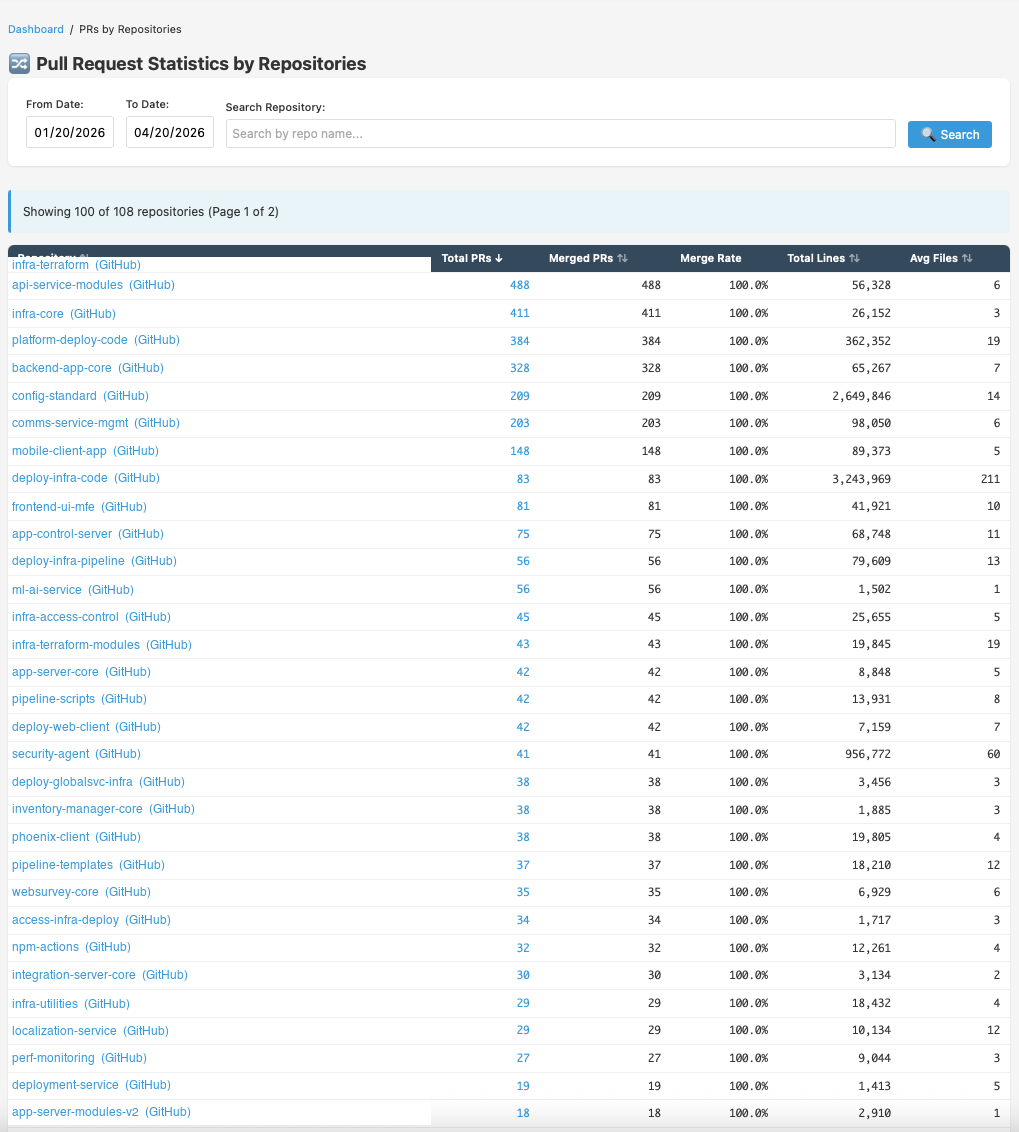
View 07, PR Statistics by Repository
Which repos ship the most PRs?
Per-repo PR volume, merged count, merge rate, total lines changed, and average files per PR across all repositories. Instantly identify where most engineering activity, and most risk, is concentrated.
100+ repos ranked by PR volume
Merge rate percentage per repo
Total lines and avg files per PR
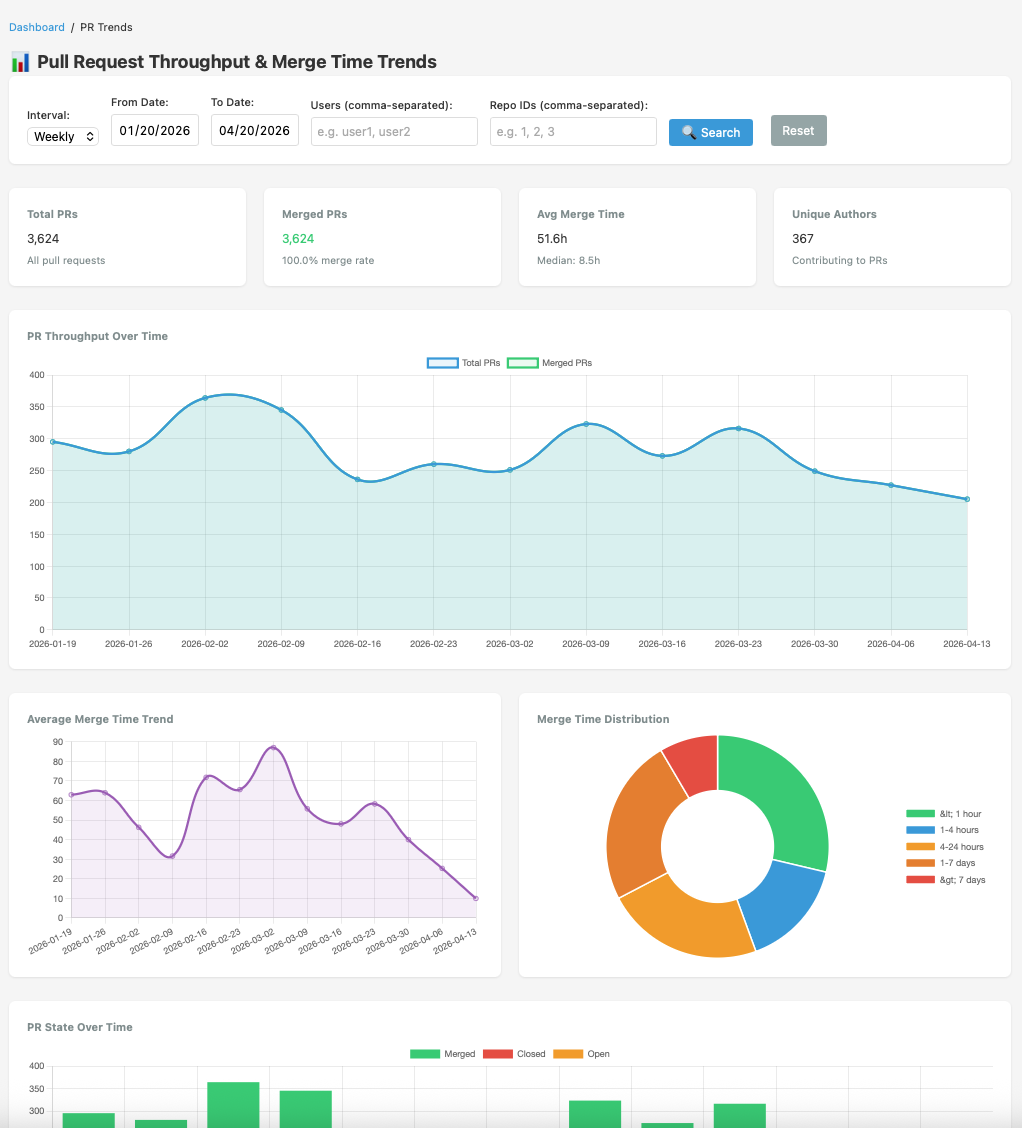
View 08, PR Throughput & Merge Trends
Are you accelerating or stalling?
Chart PR volume, merge rate, open PR count, and merge time distribution across any date range. See whether your team is shipping faster, accumulating review backlog, or both.
Opened vs. merged vs. still-open breakdown
Merge time distribution histogram
Daily, weekly, or monthly granularity
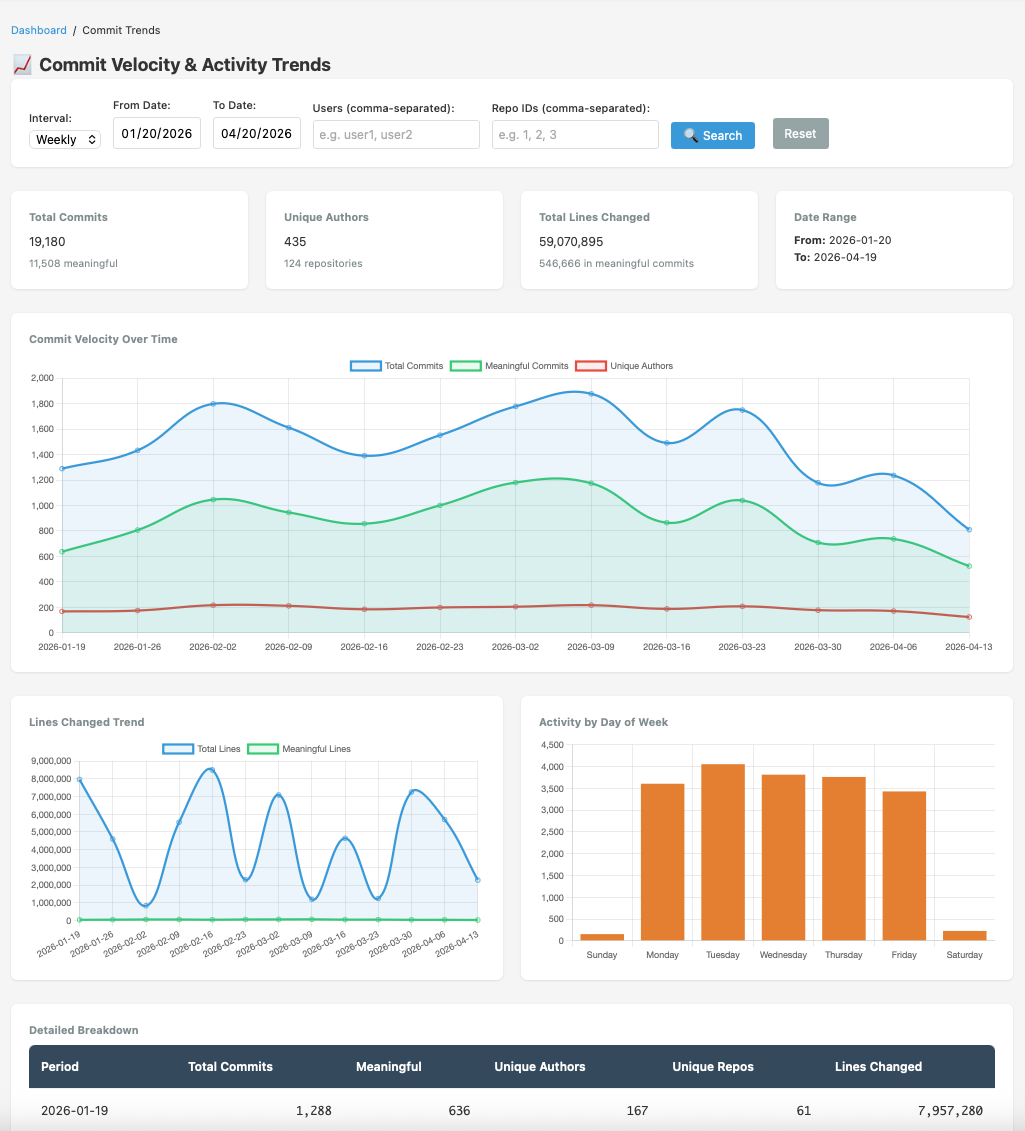
View 09, Commit Velocity & Activity Trends
Is your team's output growing?
Track commit velocity, unique active authors, and activity patterns over time. Spot sprint peaks, holiday dips, and sustained output trends across the whole organisation or filtered by team.
Commit count and unique-author count overlaid
Configurable time granularity
Team and repo filter available
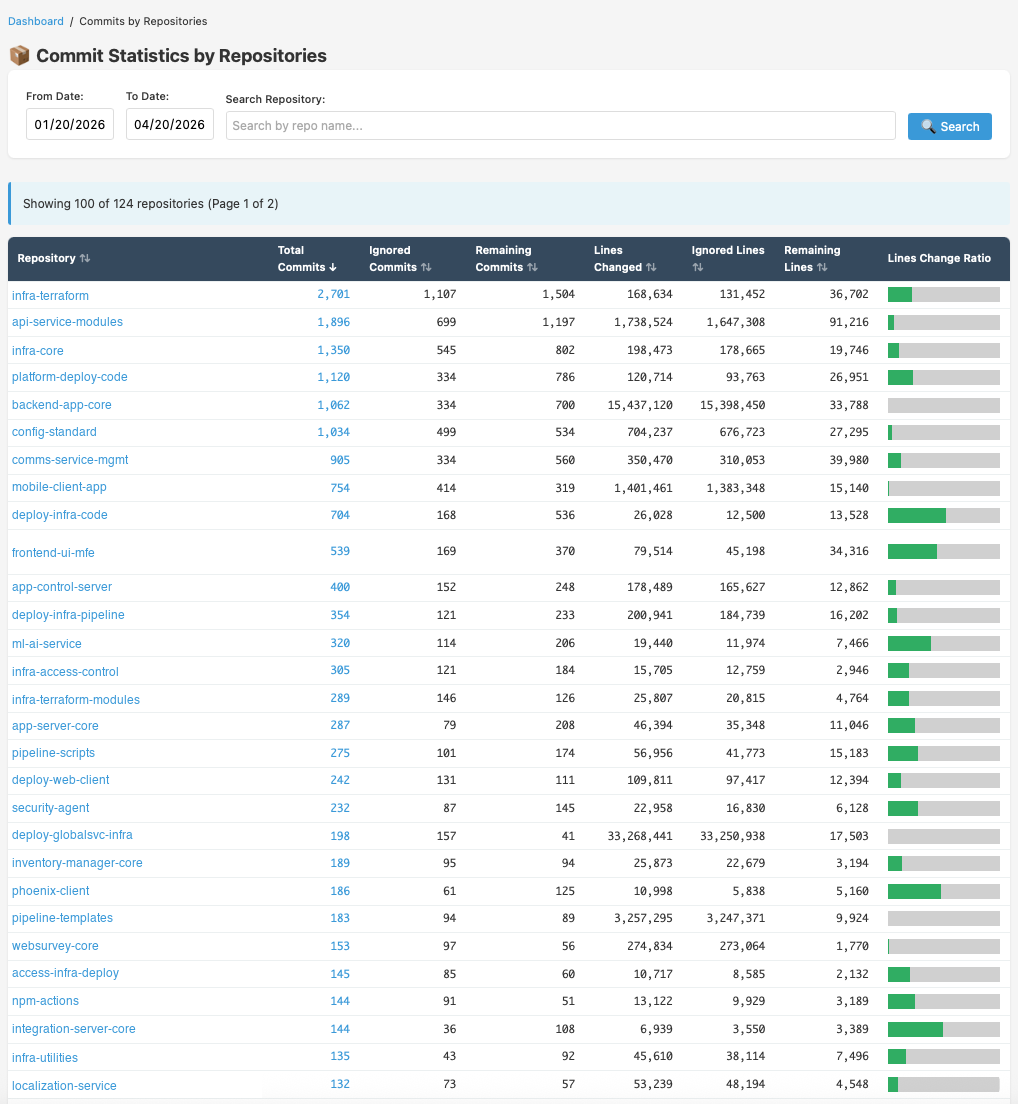
View 10, Commit Stats by Repository
Which repos need attention?
Per-repo breakdown of total commits, ignored vs. remaining commits, lines changed, and lines-change ratio, helping you identify repos with disproportionate noise or outsized churn.
Total, ignored, and remaining commit counts
Lines-change ratio bar for quick scanning
Configurable date range filtering
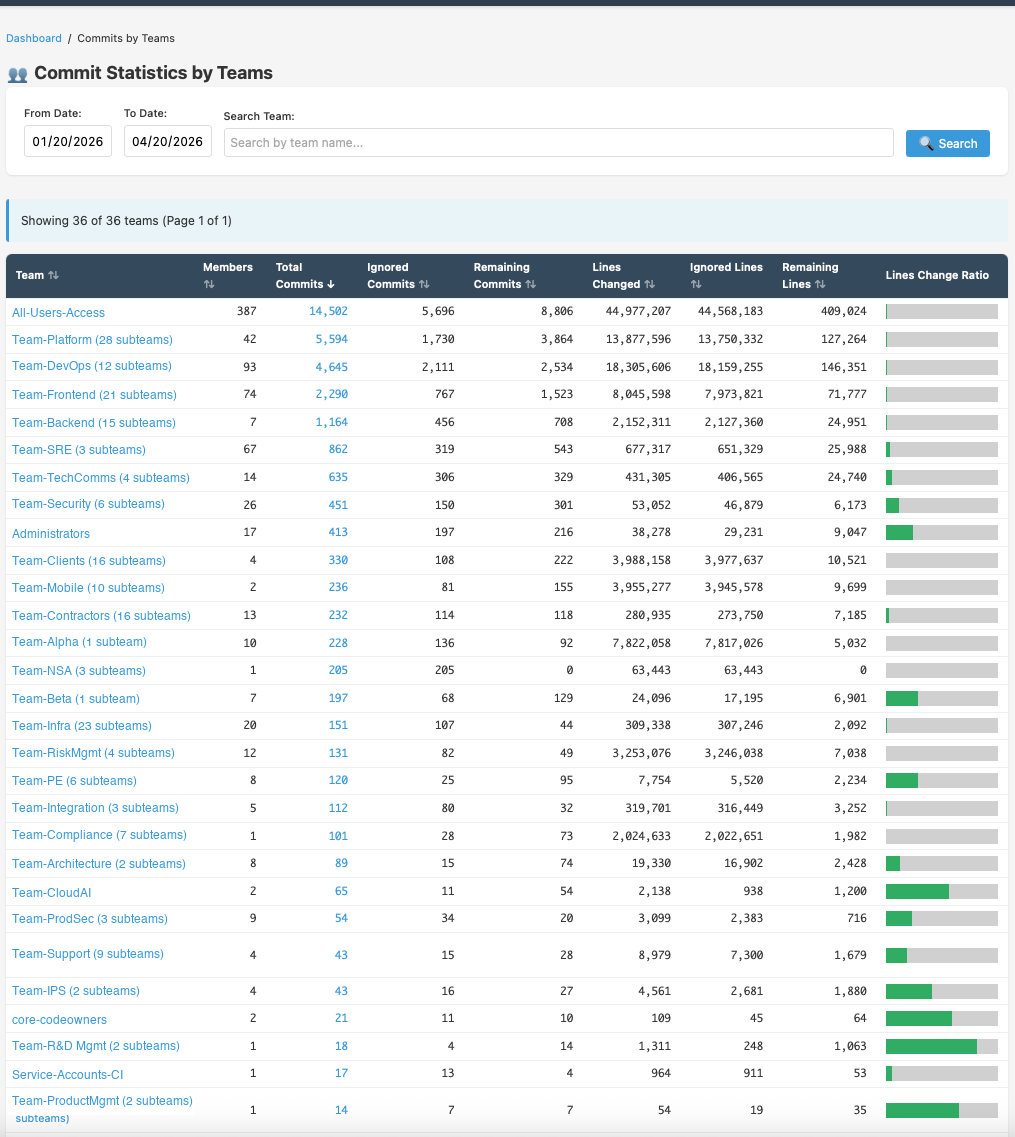
View 11, Commit Stats by Team
Team commit volume at a glance
Team-level breakdown of total commits, ignored commits, remaining meaningful commits, lines changed, and lines-change ratio, so you can benchmark teams against each other on output quality.
36 teams tracked with full commit metadata
Ignored vs. remaining split per team
Lines-change ratio bar for visual comparison
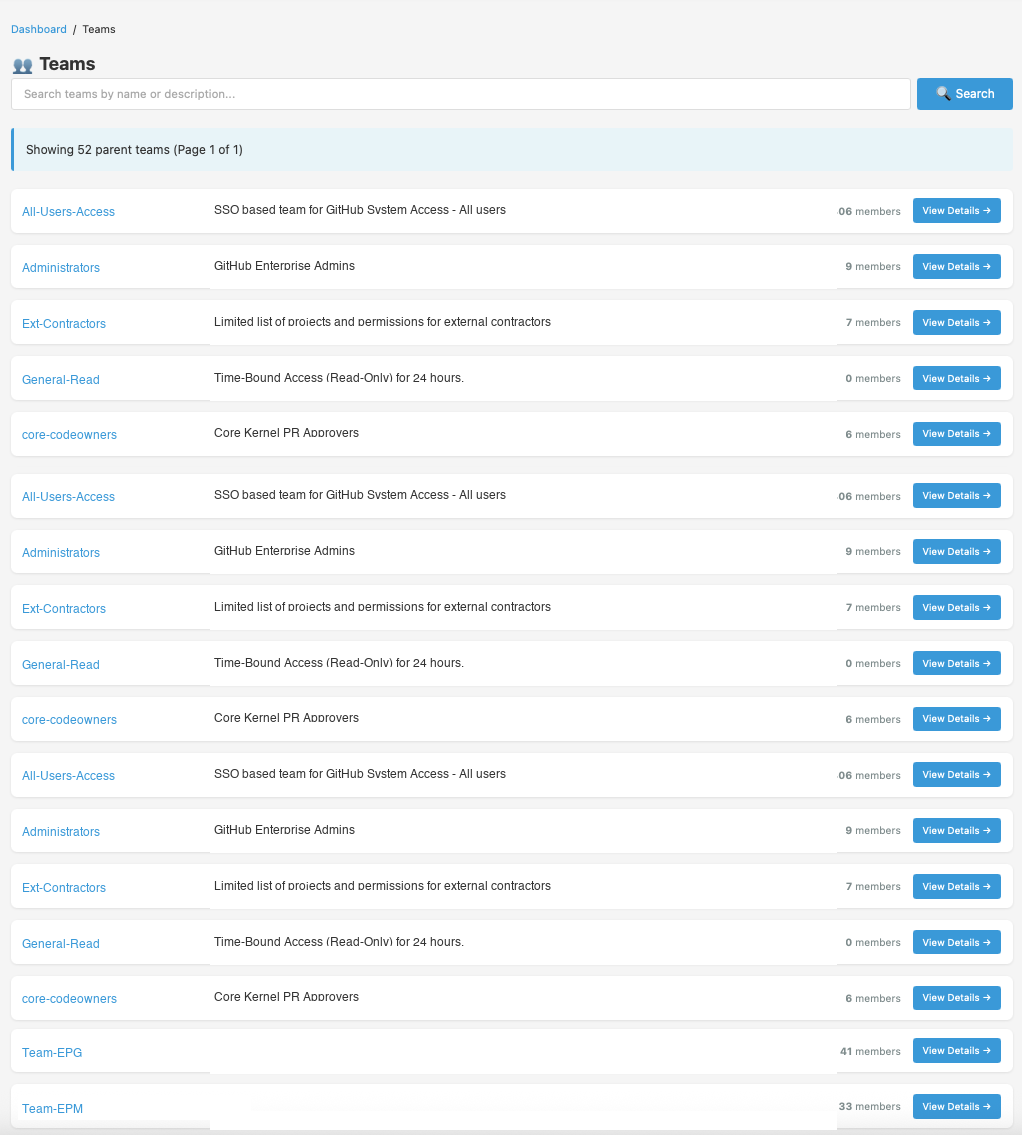
View 12, GitHub Teams View
Your org structure, reflected
Browse all parent teams and their sub-teams as synced directly from GitHub. Each card shows the team name, description, member count, and a link to drill into detailed analytics for that team.
52+ parent teams with full sub-team tree
Member count per team
One-click to team detail view
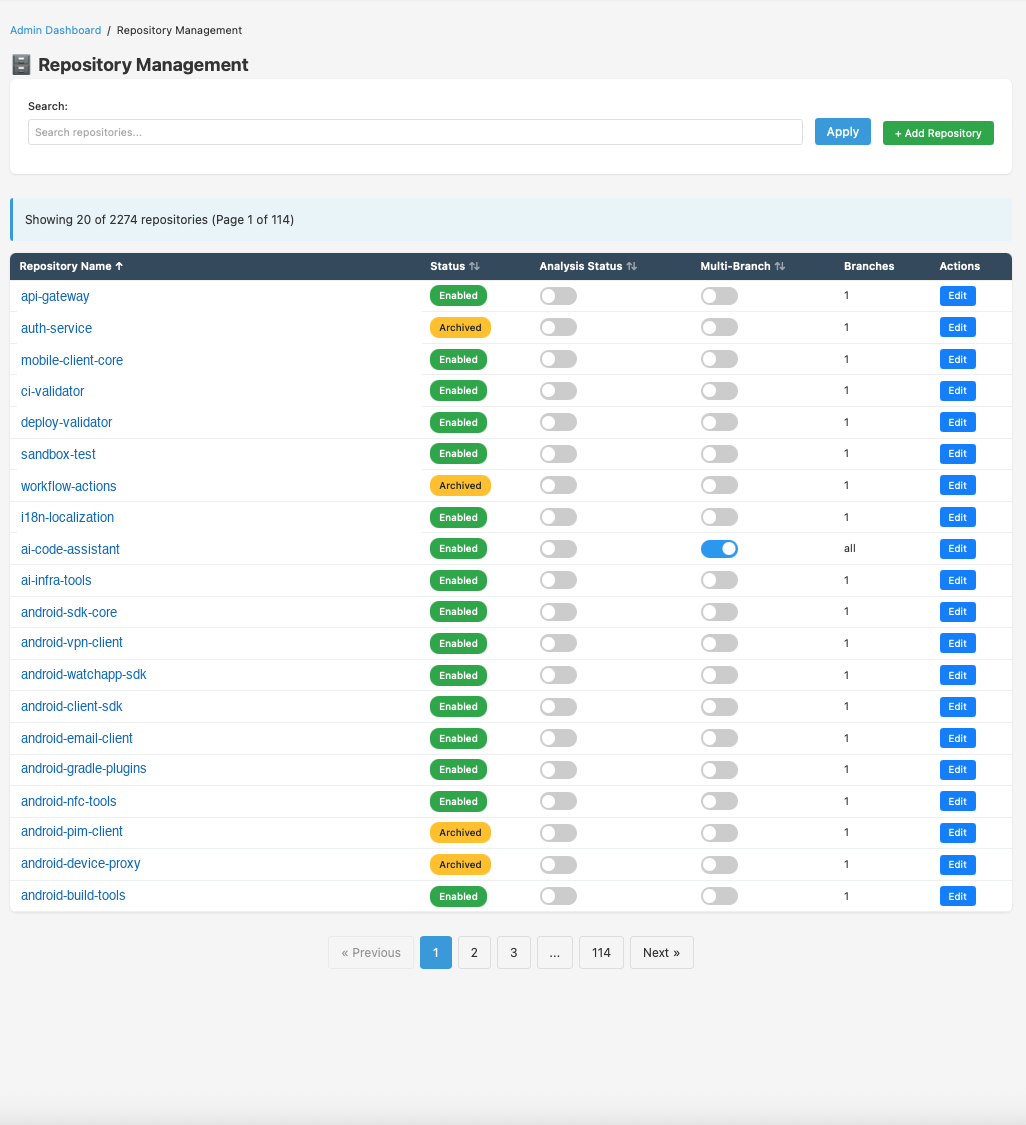
View 13, Repository Management
Control what gets analysed
Enable or disable individual repositories for data collection from the Admin UI. Set local clone preferences, inspect last-fetch status, and configure which repos drive your analytics, without touching config files.
Per-repo enable / disable toggle
Local clone size and fetch-method config
Last-synced timestamp per repo
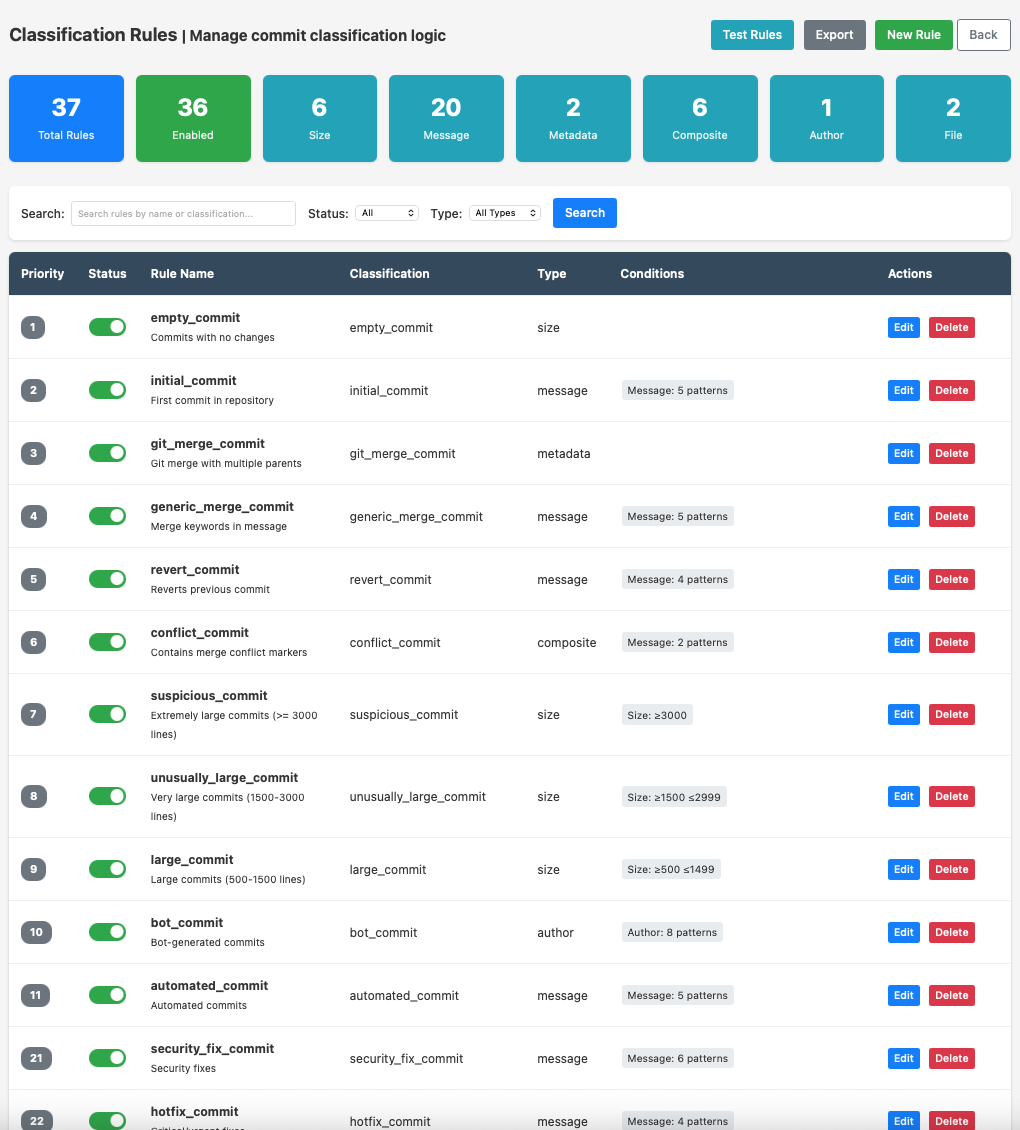
View 14, Classification Rules Admin
Tailor the rules to your team
Add, edit, or disable commit classification rules directly from the UI, no source code changes required. Rules match against commit messages, diff sizes, and branch names to assign one of 30+ semantic labels.
Full CRUD on all classification rules
Rule priority and enable / disable toggle
Changes take effect on next classification run
How it works
Designed for easy self-hosting
Gitlyzer is modular by design. Each job runs independently, fetch only what you need, as often as you need it.
1
Install & Configure
Clone the repo, run pip install -e ., copy config-example.yaml and add your GitHub token and DB connection.
2
Apply DB Schema
Create a PostgreSQL database and run psql -d gitlyzer-v2 -f db/gitlyzer_create_tables.sql. 11 tables, all foreign-keyed, with proper cascade deletes.
3
Fetch Your Data
Run jobs from jobs/ to sync repos, commits, PRs, users, and teams. Use --since / --until or automate with cron.
4
Explore the Dashboard
Run python run_webapp.py and open localhost:8082. Filter by date, team, or user, every chart is interactive and drill-down ready.
Admin Area
Secure administrative control
A full-featured admin interface protected by Flask-Login session authentication and bcrypt password hashing, no plain-text credentials, ever.
Repository Management
Enable or disable repositories via AJAX toggles. Search, sort, and control which repos are actively tracked, no script restarts needed.
Admin User Management
Create and manage admin accounts with bcrypt-hashed passwords. Protected against deletion of the last admin to prevent lockout.
Data Sync Dashboard
Trigger fetch jobs directly from the UI, pull latest commits, PRs, users, or teams on demand without touching the command line.
Classification Rules Manager
Customise commit classification rules through the admin UI. Add, edit, or disable patterns without touching source code or restarting the server.
Quick Start
Up and running in minutes
Follow these steps to get Gitlyzer collecting your GitHub data on your own infrastructure.
1
Clone & Install
Use editable install so all project imports resolve correctly from the root.
git clone https://github.com/satsha7/gitlyzer
cd gitlyzer
pip install -e .
2
Configure
Copy the example config and fill in your GitHub token and PostgreSQL connection details.
cp config/config-example.yaml config/config.yaml
# Set GitHub token, DB host/name/user/password
export FLASK_SECRET_KEY="your-strong-random-key"
Git (for local clone mode) Optional, enables faster fetching without API rate limits
Key Dependencies
requests, GitHub API
psycopg2-binary, PostgreSQL
GitPython, Local clone mode
Flask, Web dashboard
pyyaml, Configuration
Dashboard: http://localhost:8082
Tech Stack
Built on proven open-source tools
No vendor lock-in. Every component is open source and runs entirely on your own infrastructure.
Python 3.9+
Core data fetching, incremental classification, and analytics layer
PostgreSQL
11-table relational schema with foreign keys, indexes, and cascade deletes
Flask
Lightweight web dashboard with Jinja2 templates and Flask-Login auth
Chart.js
Interactive, responsive charts for all trend and analytics views
Free & Open Source
Ready to understand your engineering organisation?
Download Gitlyzer, connect your GitHub token, and have your first analytics dashboard running in under 30 minutes, entirely on your own infrastructure.